The following guide is designed to provide an introduction to the call reporting features of the MiVoice Office Application Suite solution.
The Reports page provides access to run reports on any internal or external calls. Depending on the license applied to the system, the following report types can be accessed:
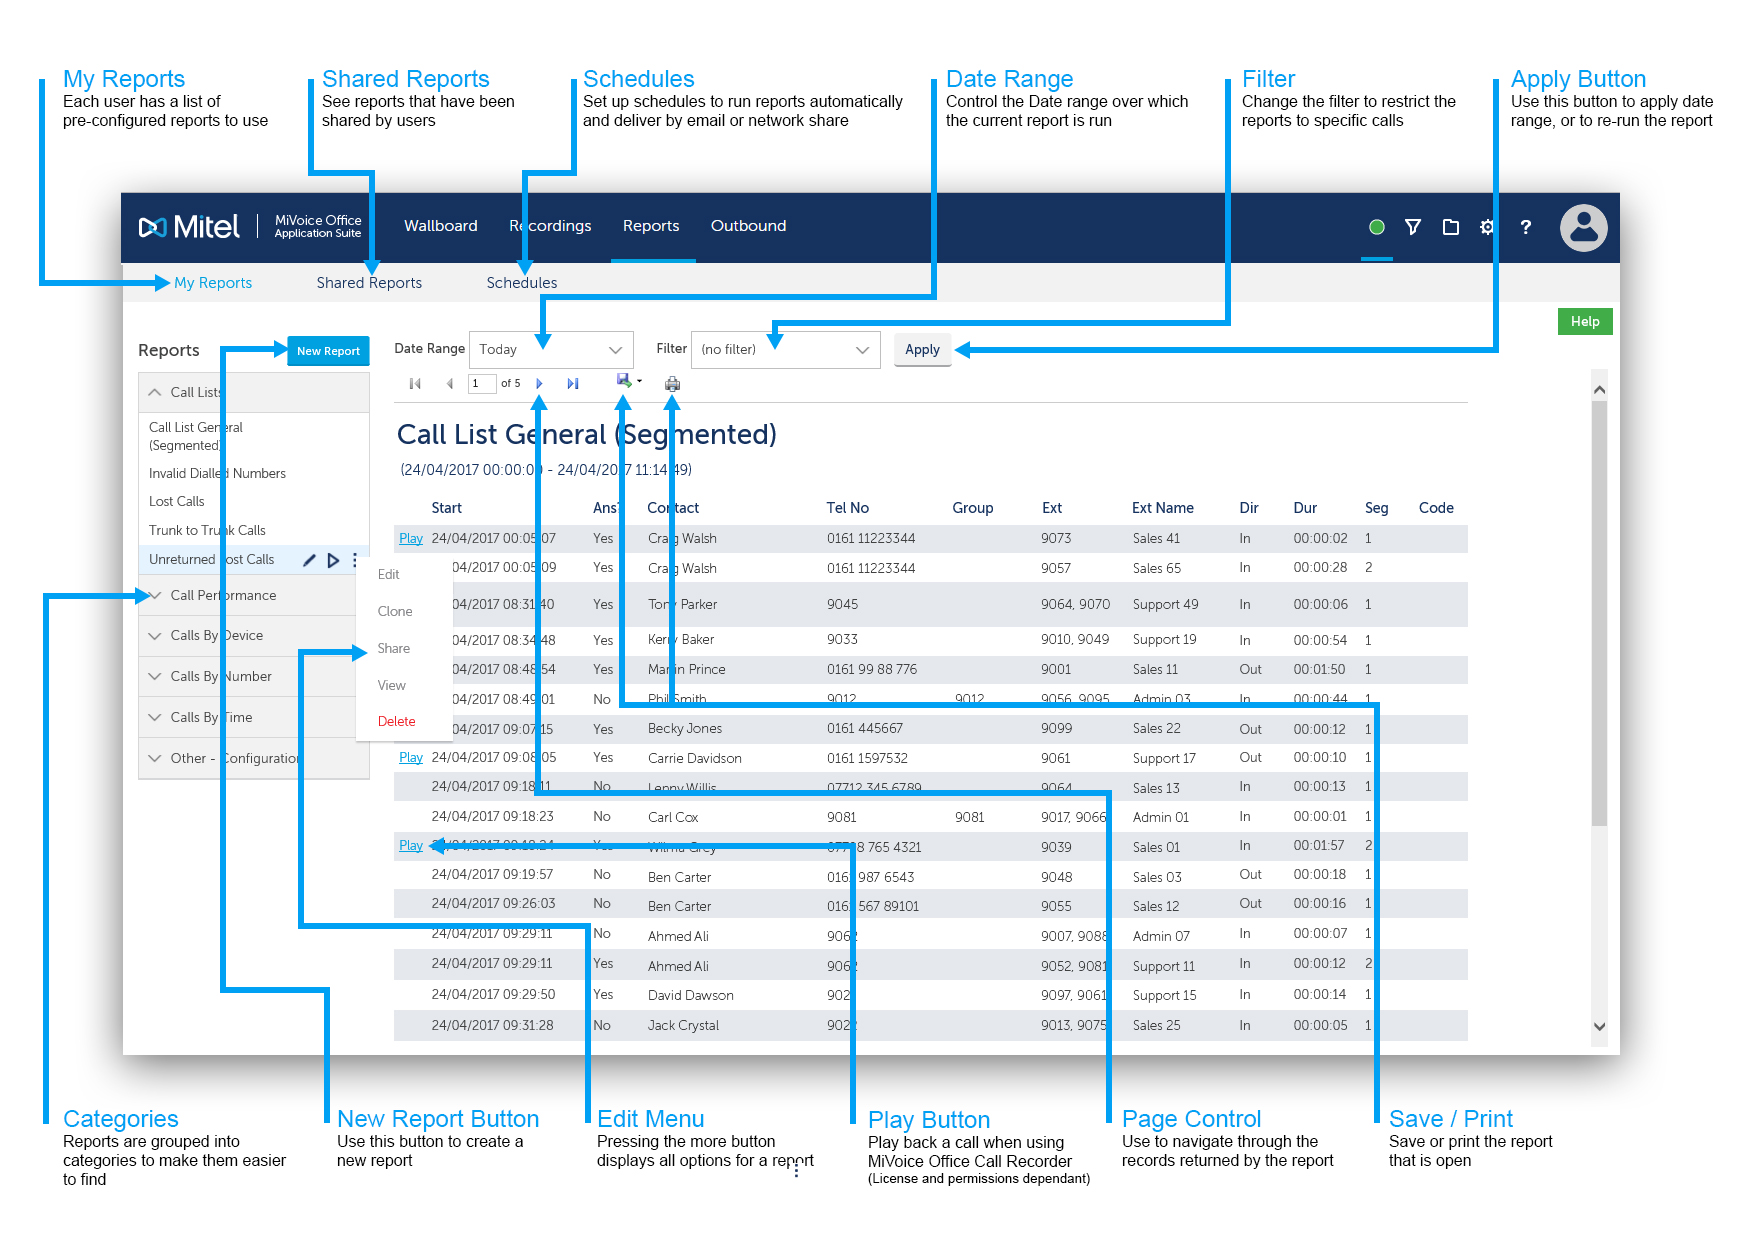
Each user has their own copy of the default reports to run. These can be modified, added to, or deleted without affecting other users on the system. The reports are grouped together in categories on the left side of the screen. To run a report, press the play icon to the right of the report in the list. The report will appear on the right side of the page using the default filter and date range that were saved against the report.
A report may be presented across multiple pages, when this happens the page navigation buttons can be used to move through the report. If the report is a grouped report, the last row will show the totals of each column where applicable. Reports can be saved in Excel, PDF or Word format or they can be printed directly from the page.
When a call is logged to the database, a new call segment is created each time the call rings or is answered by a different device on the telephone system. A single external call can have many call segments. It is important to understand this when looking at call reports and evaluating call totals. For example, if looking at a Segmented Call List, a call will appear multiple times, once for each destination it was delivered to.
For more information on call segmentation and how it applies to different Reports/Templates, please refer to the product help document.
There are two different types of reports that can be run; lists or grouped reports. Lists can provide details of individual calls or call segments. Grouped reports provide aggregate columns that include totals, averages and minimum/maximum values. These reports provide a way of analyzing call traffic and how quickly calls are being answered.
The date range and filter can be used to select which calls are included in the reports. Any changes to a filter or date range require the report to be re-run using the 'Apply' button. The system will cache reports that have be run before, if the report has not been edited and the date range/filter has not changed, a cached version of the report will be loaded to improve performance.
Reports can be shared so that other users can see and modify them. When a report is shared, a shared copy of the report is created, leaving the original in the 'My Reports' section. Shared reports can be modified by any users with permission to access them.
Every report in the 'My Reports' section is specific to the user logged in and can be added to, edited, or deleted as required without affecting other users. When editing a report, the form pictured below will be displayed.
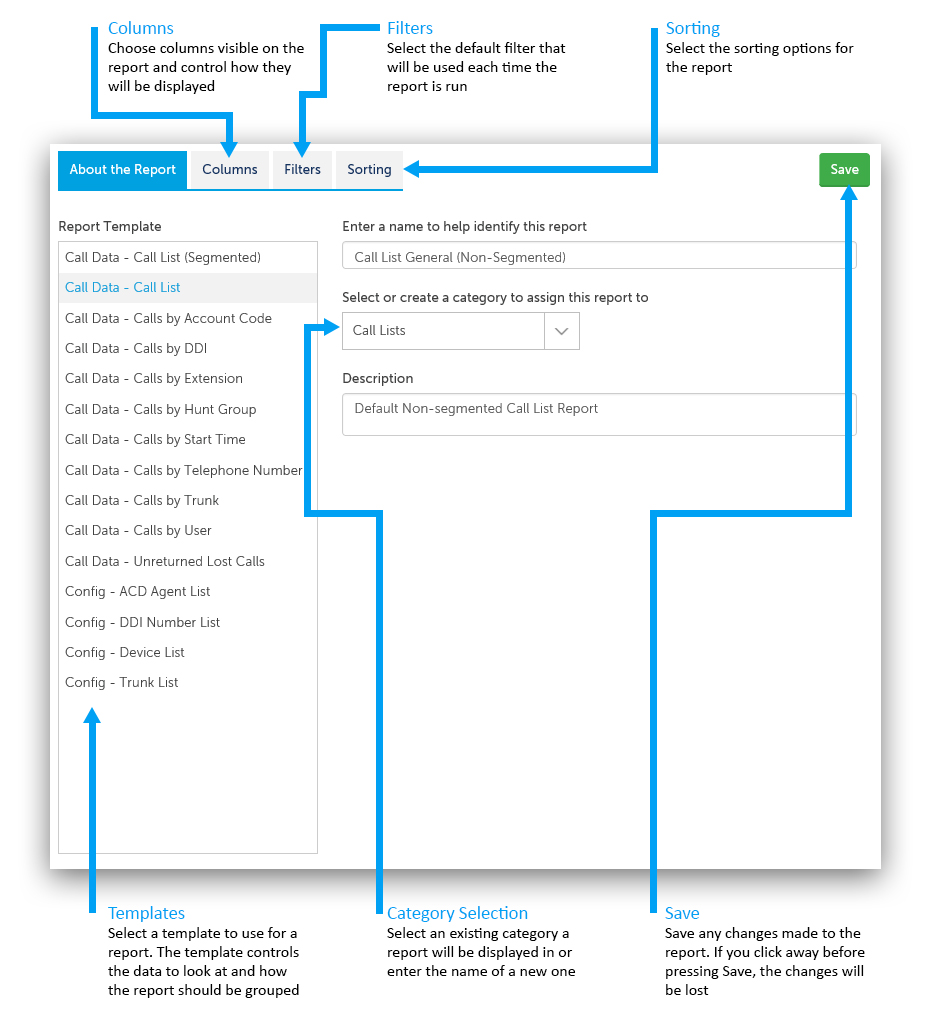
Each report is based on a report template. A report template defines what data is being reported on (call or configuration), how the data is to be grouped (By Extension, By Agent, Not Grouped etc..) and which columns are available to choose from. Changing the template of an existing report will change the available columns, this in turn will set the chosen columns back to default.
Reports are saved into different categories to make them easier to find in the user interface and to group together similar reports. The category a report is saved in can be selected from the list or a new category name can be entered.
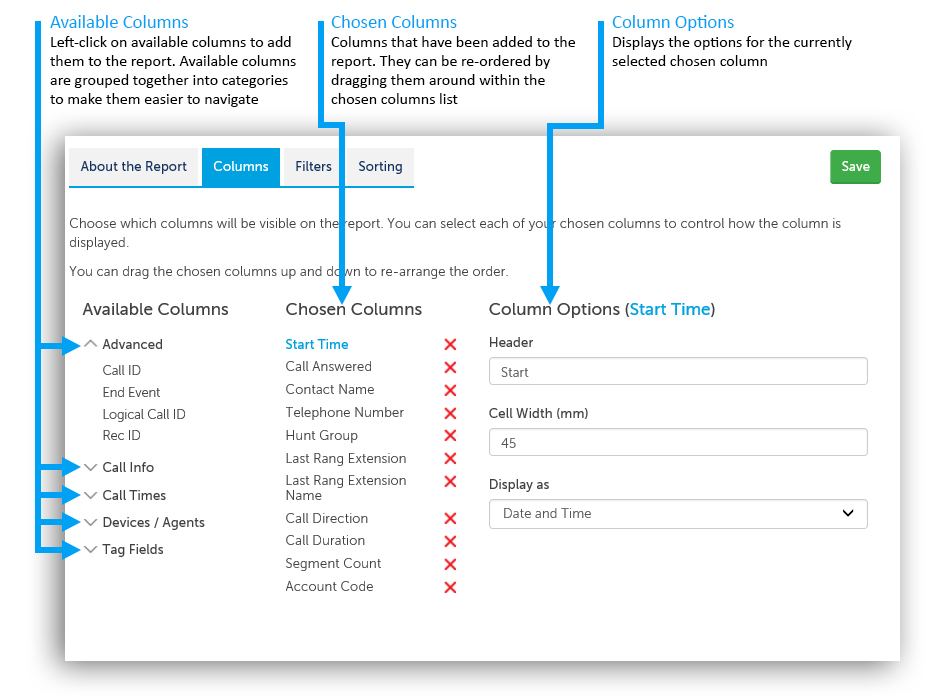
Each report comes with default columns added. A list of the available columns to add to the report appears on the left side of the 'Columns' tab, split up into categories to help locate the required column. To add a column to a report, left click on it. Chosen columns can be re-ordered by drag and drop or removed using the cross icon.
If the report is grouped, the column the report is grouped by will appear in blue. Grouped by columns cannot be removed from a report.
The options available to configure will be different depending on the column type. The 'Header' is the name that will be displayed for this column in the report. These are defaulted to a shortened variant of the column name but can be overridden by the user (the column name appears as a tooltip if you hover over it in an open report).
Where applicable, the 'Display as' option controls the format of the data shown in the report.
Select the default filter and date range to be assigned to a report when it is opened. This can then be overridden once the report is run using the date range and filter dropdown boxes on the report viewing page.
Select the sort order for the report. Reports can be sorted by more than one column if required, but the sort direction (ascending or descending) will need to be the same for all sorted columns.
The optional scheduler can be used to automatically run reports on a regular basis and either deliver them by email or save them to a network share.
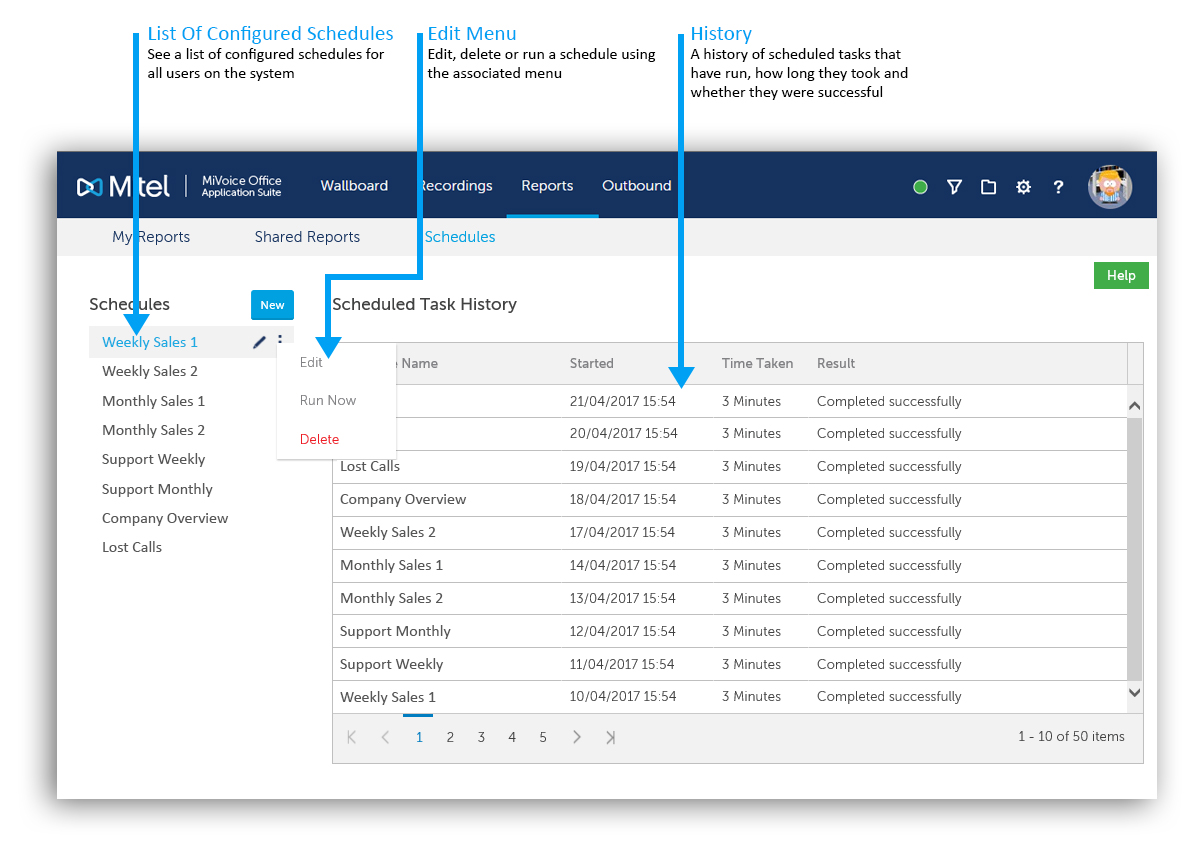
The 'Schedules' page shows all schedules that have been configured on the system, regardless of the user that configured them. Any user with permission can add, edit or delete a schedule. The 'Scheduled Task History' table shows when the schedules have run and whether they were successful or not. Schedules can be run manually as a 'one-off' irrespective of the recurrence settings, by selecting the 'Run Now' option from the menu.
Only shared reports and shared filters can be used in a schedule. This is because schedules are a system-wide concept that can be edited by anyone. Therefore the reports and filters being added to a schedule need to be visible to everyone.
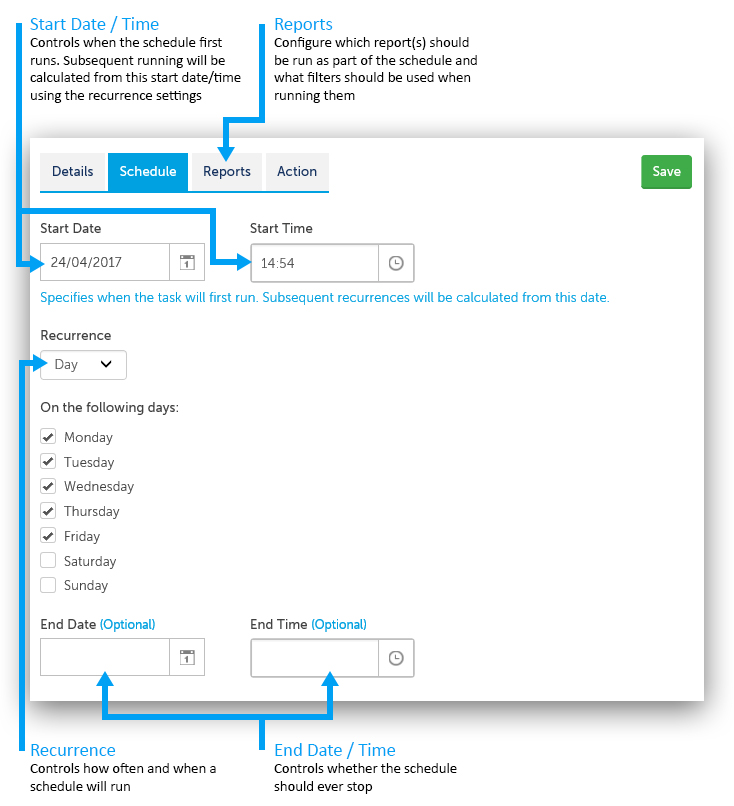
The 'Start Date' and 'Start Time' for a schedule is used to work out when a schedule will first be run. After this, the configured 'Recurrence' will be used to work out when the next schedule should be run. The table below shows the different options available for recurrence:
| Recurrence | Description |
|---|---|
| Minute | Run every 'x' minutes (minimum 15 minutes). Select the days of the week to run and between what times. |
| Hour | Run every 'x' hours. Select the days of the week to run and between what times. |
| Day | Once a day at the time configured in 'Start Time'. Select the days of the week to run. |
| Week | Run event 'x' weeks at the time configured in 'Start Time'. |
| Month | Run every 'x' months at the time configured in 'Start Time'. Select the day of the month on which to run the schedule. |
The 'End Date' and 'End Time' can be used if required to stop the schedule automatically.
Select the report(s) that will be run by the schedule and filter/date range to use for each one. When applying the date range it is advisable to use a contextual date range (this week, last week etc..). If a 'Custom' date range is selected, the date range will be fixed every time the report is run by the scheduler.
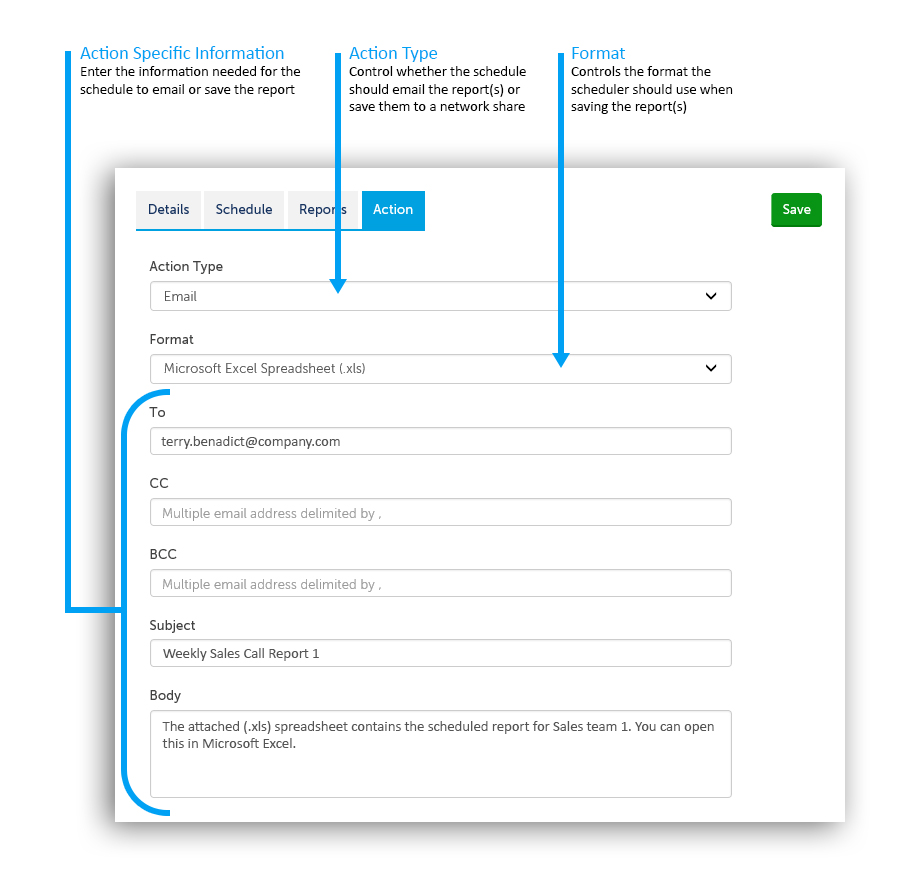
Reports can either be saved to a network share or emailed. In addition, the format of the report can be selected. Supported formats are Microsoft Word, Microsoft Excel and PDF.
Reports can be emailed to one or more users of the system. Multiple email addresses can be added to any of the address fields (To, CC & BCC) using a comma separated list.
To save the export to a network share, the details for the network share must first have been configured by the administrator of the system.
The title bar provides access to areas of the App Suite. The image below outlines each of the navigation icons:
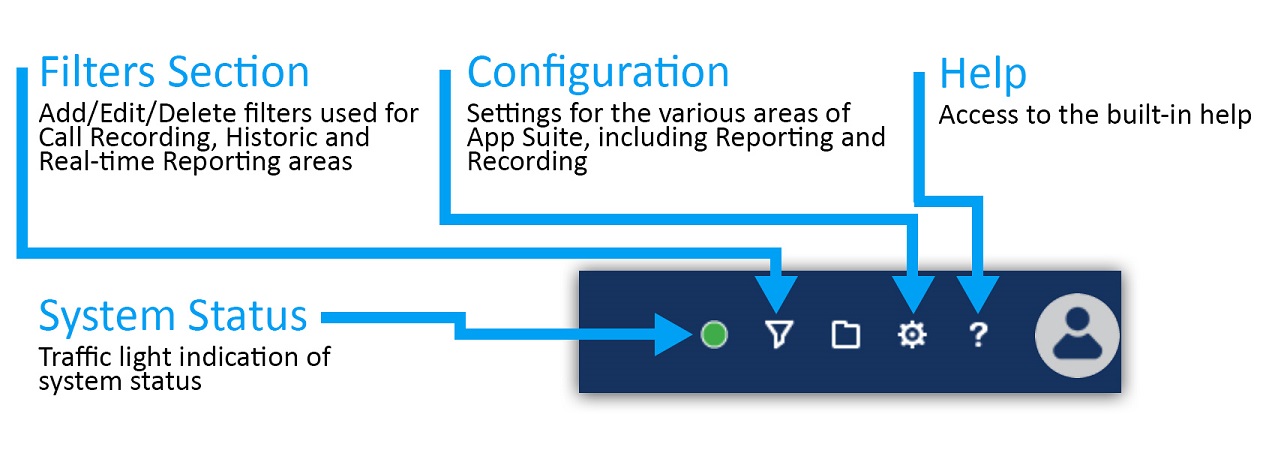
The configuration section and system status will only be visible with the correct permissions.
The 'Filters' section of the website is used to manage all the saved filters on the system. Filters can be used with reports or recordings.
Each user has their own 'My Filters' section that provides a list of all filters they have created.
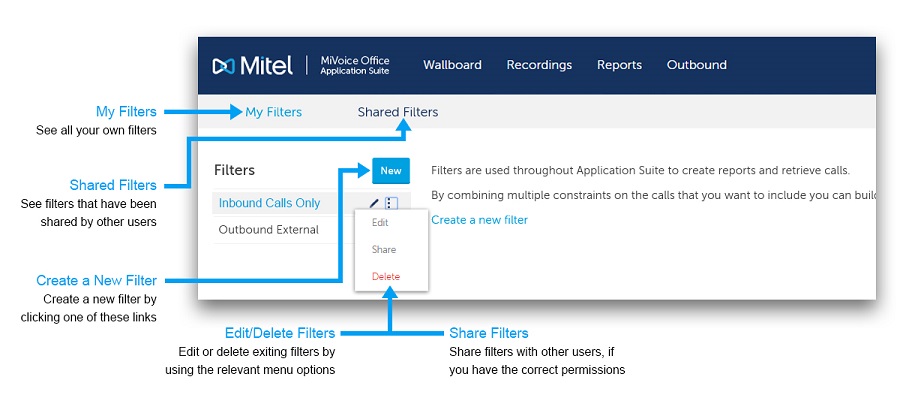
Filters can be shared between users to avoid duplicating work and to allow administrative staff to set up filters that can be used by everyone.
Each filter provides the ability to search on one or more details about a call. The details are grouped into tabs. The tabs are displayed with descriptions in the image below:
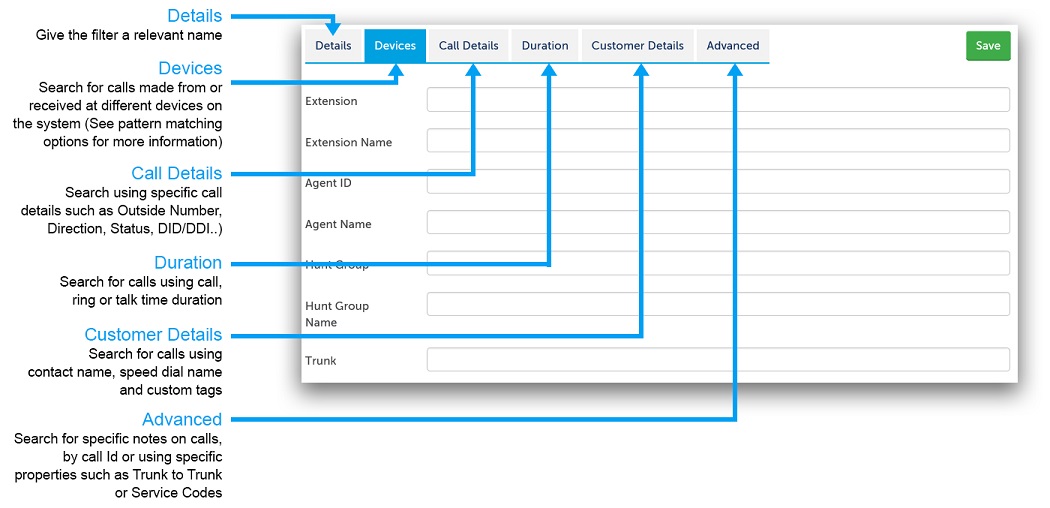
The use of special characters within the text boxes for a Filter enables the use of complex filter strings.
The following characters are supported:
| Special Characters | Description |
|---|---|
| Exclamation mark (!) | Not equal to |
| Percent (%) | Fuzzy matching (equivalent to a SQL LIKE %) |
| Underscore (_) | Fuzzy matching of a single character |
| Comma (,) | Can be used to search for multiple values at the same time |
In addition to the special characters above, the following characters are supported when searching using a device based field (Extension, Agent, Trunk, Hunt Group):
| Special Characters | Description |
|---|---|
| Plus sign (+) | Greater than or equal (e.g. 1000+ for extensions greater than or equal to 1000) |
| Hyphen (-) |
Delimits a range of values to match (e.g. 1000-2000 for all extensions between 1000 and 2000 inclusive) |
The example below shows what would be matched when entering combining multiple special characters using a comma:
Matching endpoints: 1000, 1001, 1002, 1004, 1005, 1040, any that start with 18 and end with a 5, any with a value greater or equal to 2000.