The following table shows the types of tile that are available, what sort of data they can display and which real-time license they are supported on.
| Tile | Data |
Wallboard
|
Dashboard
|
|---|---|---|---|
| Single Statistic |
|
Yes |
Yes |
| Multiple Statistic |
|
Cycling Statistic Tile Only (Limited to 2 Statistics) |
Yes |
| Ticker |
|
Yes (Limited to 1) |
Yes (Limited to 1 per View) |
| Media |
|
Yes |
Yes |
| Grids |
|
No |
Yes |
One or more of these tiles can be added to a view. Each tile can show a single piece of information at a time and can have it's fore/background color customized as required.
Single statistic tiles have two display modes:
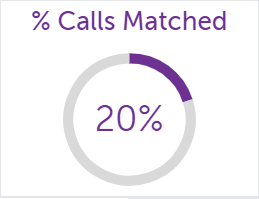
Example single statistic tiles:

One or more of these tiles can be added to any real-time view (limited to cycling tiles only on a Wallboard view). The multiple statistic tile can be configured with up to 20 pieces of information. There are three display modes to choose from when creating a multiple statistic tile:
Once the tile has been created, the display mode can be changed at anytime from the tile's appearance tab.
The foreground color of each statistic added can be configured separately so they can be distinguished from each other.
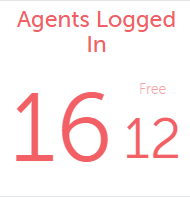
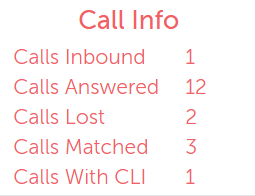
Example multiple statistic tiles:
A single ticker tile can be added to a view. The ticker can have up to 20 pieces of information added to it. There are three appearance options associated with the ticker:
Each piece of information added to the tile will scroll along it in the order it was added. If there are a large amounts of data on the ticker it may not be possible to see all pieces of information at the same time.
Example ticket tile:

One or more media tiles can be added to a view. Each media tile can be configured to play one of the following:
If displaying video content, the config tab provides an option for selecting the aspect ratio of the video. The tile will try and auto detect the aspect ratio by default but can be overridden by selecting '16:9' or '4:3'. The video will start with the audio on, this can be changed by muted if required.
One or more grid tiles can be added to a view. Grid tiles can be used to show data by device or call rather than system wide.
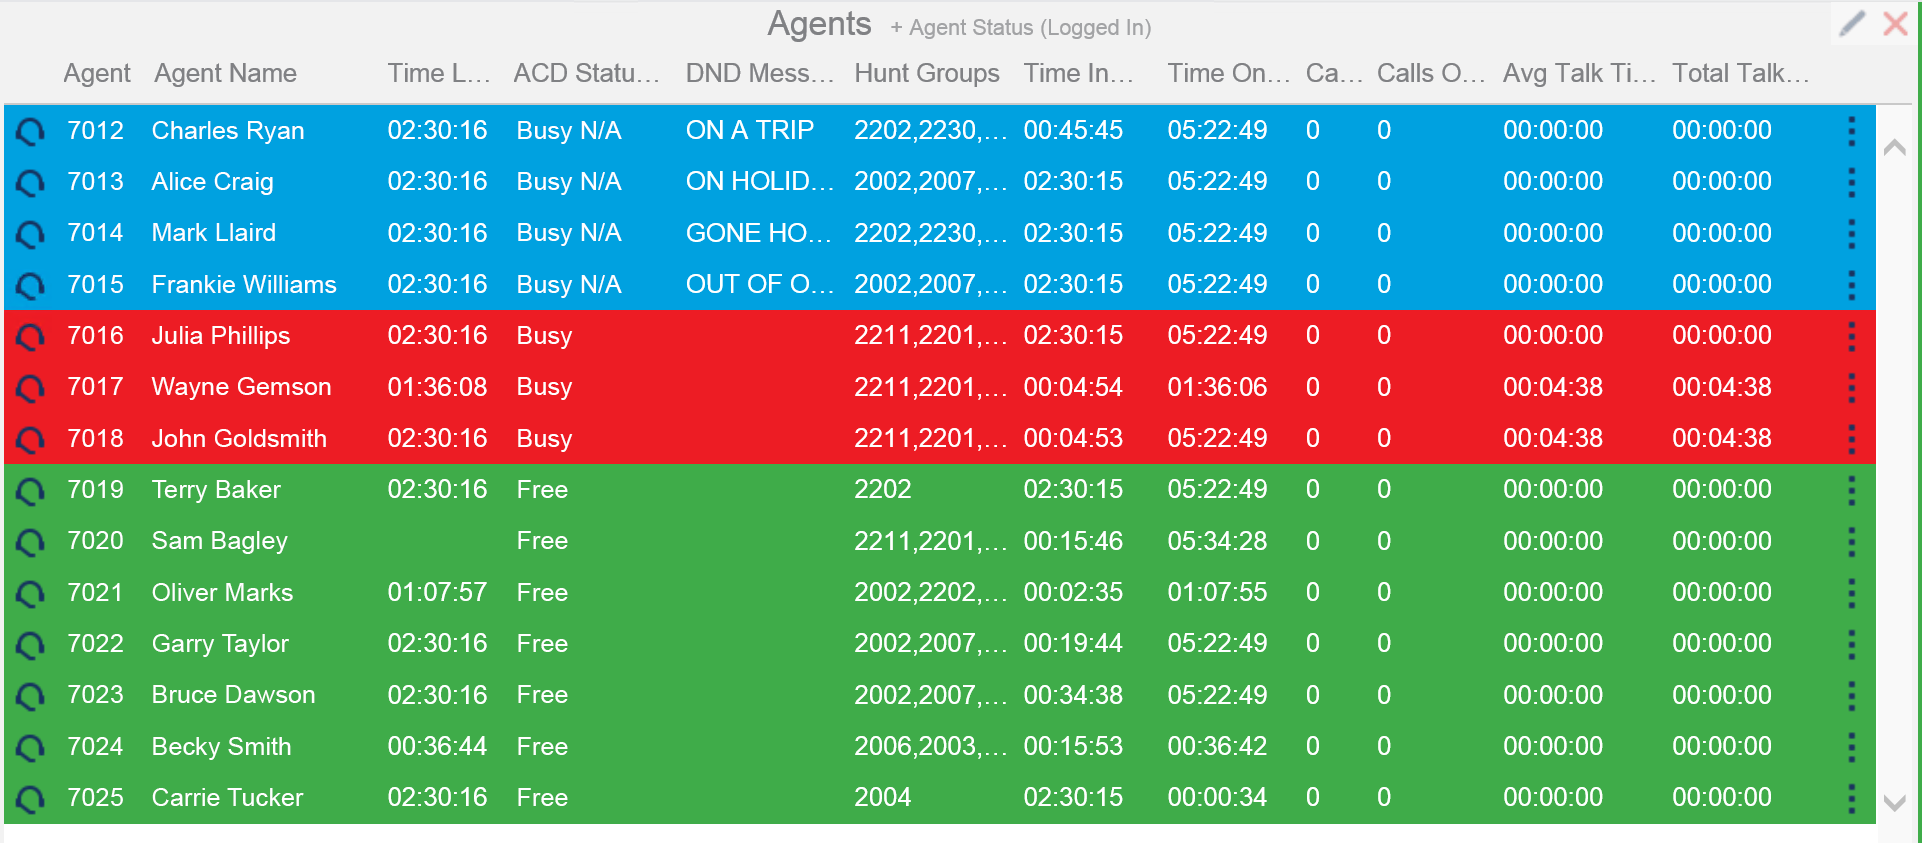
Displays all the ACD agents on a system with the background color for each row indicating their ACD status. The agent grid can be filtered as per any other tile but also has the option for not displaying agents that are currently logged out.
| Background Color | Status |
|---|---|
| White | Logged Out |
| Green | Free |
| Red | Busy (On a call) |
| Yellow | Wrap-Up |
| Blue | Do-Not-Disturb |
| Grey | Offline |
| Light Grey | Unlicensed |
The table below shows the status icons that are shown on an Agent Grid.
| Icon | Description |
|---|---|
 |
Logged In |
 |
Logged Out |
 |
Call In Progress |
 |
Busy N/A (Do-Not-Disturb) |
The screen shot below shows an example Agent Grid.
Displays all active calls on the system (internal & external) with the background color for each row indicating the calls status.
| Background Color | Status |
|---|---|
| White | Internal Call |
| Green | Outbound Call |
| Yellow | Inbound Call |
The table below shows the status icons that will display on a Call Grid.
| Icon | Description |
|---|---|
 |
Call In Progress |
 |
Call On Hold |
 |
Call Ringing In |
 |
Call Ringing Out |
The screen shot below shows an example Call Grid with an inbound, outbound and an internal call.

Displays all the extensions configured on the system with the background color of each row indicating the trunk/call status. The call data displayed is segmented.
| Background Color | Status |
|---|---|
| White | Idle (No call) |
| Green | Outbound Call |
| Yellow | Inbound Call |
| Grey | Offline |
The table below shows the status icons that can be displayed on an Extension Grid.
| Icon | Description |
|---|---|
 |
Extension Idle |
 |
Extension Offline |
 |
Call In Progress |
 |
Call On Hold |
 |
Call Ringing In |
 |
Call Ringing Out |
 |
Do-Not-Disturb |
The screen shot below shows an example Extension Grid.

Displays all hunt groups that are configured on the telephone system. The background color indicates the status of the hunt group in regard to agents free and calls queuing.
| Background Color | Status |
|---|---|
| White | UCD Hunt Group |
| Green | Agents Free |
| Yellow | No Agents Free / No Agents Logged In |
| Red | Number of Calls Ringing is greater than the number of Agents Free |
The screen shot below shows an example Group Grid.

Displays all trunks that are active on calls. The background color indicates the direction of the call (Yellow -> Inbound, Green -> Outbound). The Icon to the left shows the status of the call.
| Background Color | Status |
|---|---|
| White | Internal Call |
| Green | Outbound Call |
| Yellow | Inbound Call |
The table below shows the status icons that can be displayed on a Trunk Grid.
| Icon | Description |
|---|---|
 |
Call In Progress |
 |
Call On Hold |
 |
Call Ringing In |
 |
Call Ringing Out |
The screen shot below shows an example Trunk Grid.
